SpeechMark Newsletter May 2024

SpeechMark Newsletter


Announcing SpeechMark MATLAB Toolbox Version 1.5

This update offers certain SpeechMark functionality that is only available through the MATLAB toolbox. It does not affect other SpeechMark products.

Improving Functionality and Style

Version 1.5 includes the new function deg_unvstop_asp16 to mark aspiration in unvoiced stops and adds functionality to vowel_segs_nsil, which is equivalent to that in vowel_segs_full, and to vowel_segs_std for more robust handling of vowels that follow the onset of nasalization.

V1.5 also contains two additional demos for testing, smdemo3, whose plots you can see at the beginning of this Newsletter; and smdemo4, which shows how to analyze a batch of speech recordings and summarize the results in a spreadsheet.

The full list of functions fixed in V1.5 can be found in the V1.5 Release Notes. We are working on a version that will contain a deeper analysis of vowels.

Tweaks and Bug Fixes
We have corrected many bugs, especially in landmarks, and improved plotting against white backgrounds. Finally, we have overhauled the Help documentation for landmarks and several other functions.

DID YOU KNOW?

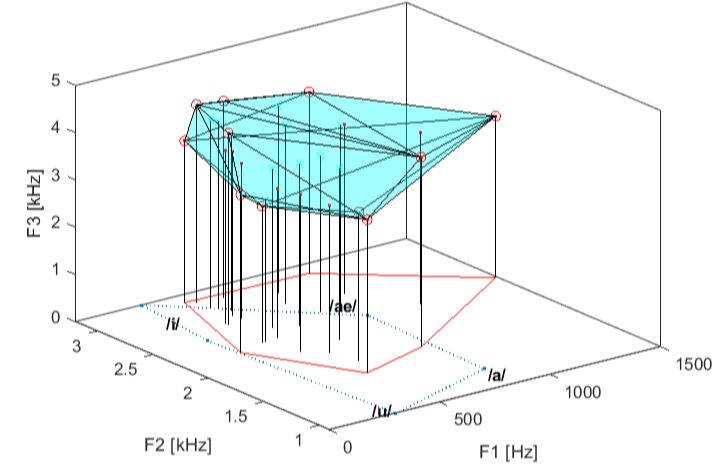
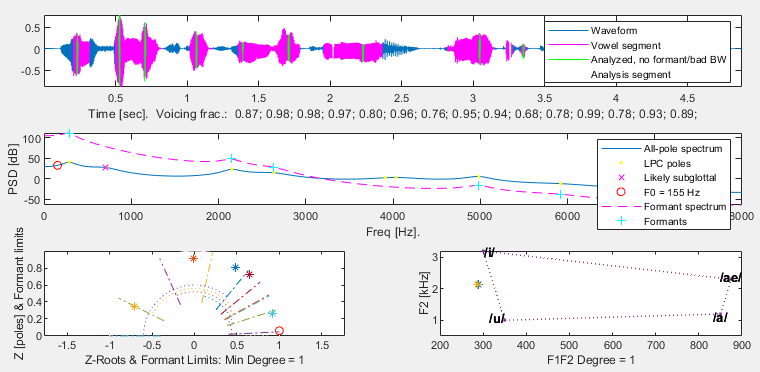
Some of the SpeechMark plotting functions produce rather complex plots. A previous newsletter discussed how you can easily edit them with the built-in MATLAB tools to change their appearance or remove elements (and even undo this when you make a mistake). Two examples of such functions are lm_draw and plot_vowelarea. If you know what to look for, you will see that they can tell you about faint or weakly detected features.

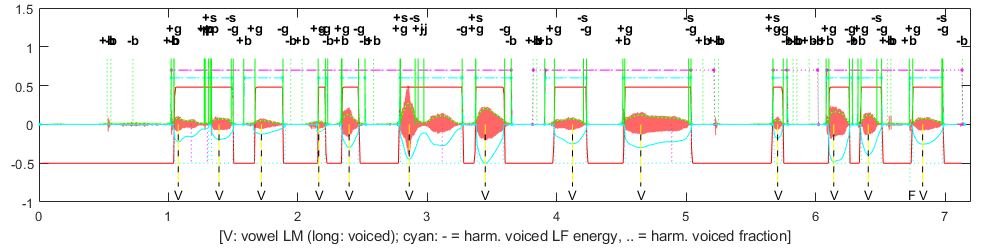
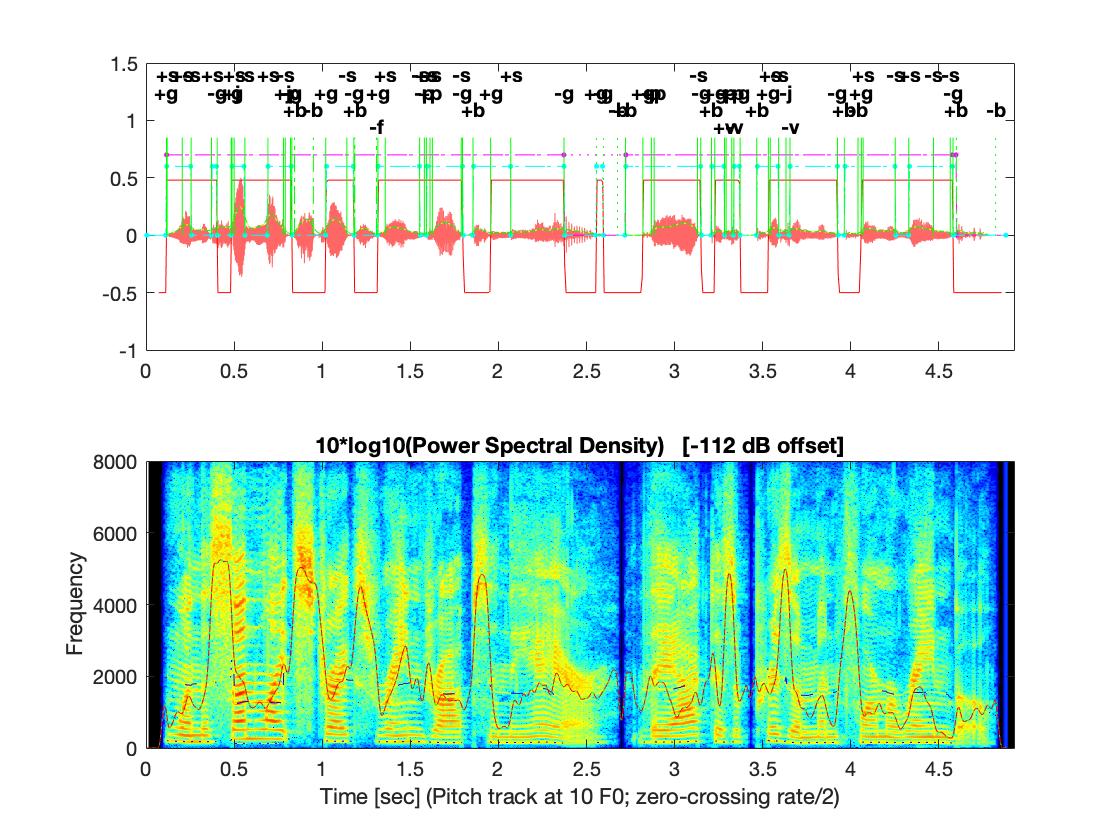
lm_draw plots a speech-acoustic signal and its spectrogram with the associated array of landmarks. In the picture below, the landmarks are shown with vertical green lines. Recall that landmarks themselves consist of a time (where the line is drawn), a type (labeled at the top), and a fuzzy-logic strength, with strength = 1 denoting certainty of membership. What you might not realize is that the solid green lines represent “full-strength” landmarks, with strength near 1, while the dotted green ones represent weaker landmarks, occurring in low-amplitude segments of the signal with a lower strength < 1/2, as in the figure below at 0.6 seconds. Based on these, horizontal cyan dashed lines connect two strong landmarks to identify the certain start and end of syllable clusters, whereas dotted cyan ones identify syllable clusters that are less certain, starting or ending at weaker landmarks, as near 5.2 seconds.

plot_vowelarea, on the other hand, plots formant sets in F1-F2 or F1-F2-F3 space, either in linear scale or logarithmic (proportional to octaves). As in the figure below, plot_vowelarea shows a vowel as a dot if all of its formants have normal bandwidth, or as an “X” if any of its formants has high bandwidth. It uses formant_decay_limits to make this determination. A true vowel’s formant can have a high bandwidth, especially if weakly detected. However, high bandwidth is sometimes an indication of some other acoustic feature, such as nasal or tracheal resonance. So these “X” points denote less-certain vowels.

While these functions can be used by themselves, both lm_draw and plot_vowelarea are called inside more frequently used functions, like landmarks and vowelarea. Therefore, lm_draw and plot_vowelarea have similar functionality and application to the functions that call them.

As always, if you need more detailed explanations of certain functions, consider reading the function’s documentation by typing ‘doc function_name’ or ‘help function_name’. If you are new to SpeechMark, try out demos smdemo1 through smdemo4 in the smdemos folder. They can familiarize you with some of SpeechMark’s features and show you how to solve your own problems. And as always, email us with questions or suggestions.

Landmark-based analysis of speech differentiates conversational from clear speech in speakers with muscle tension dysphonia (2023)

Keiko Ishikaw, Mary Pietrowicz, Sara Charney, Diana Orbelo
This study evaluated the feasibility of differentiating conversational and clear speech produced by individuals with muscle tension dysphonia (MTD) using landmark-based analysis of speech (LMBAS). Thirty-four adult speakers with MTD recorded conversational and clear speech, with 27 of them able to produce clear speech. The recordings of these individuals were analyzed with the open-source LMBAS program, SpeechMark®, MATLAB Toolbox version 1.1.2. The results indicated that glottal landmarks, burst onset landmarks, and the duration between glottal landmarks differentiated conversational speech from clear speech. LMBAS shows potential as an approach for detecting the difference between conversational and clear speech in dysphonic individuals.

Copyright (2023) Acoustical Society of America. This article may be downloaded for personal use only. Any other use requires prior permission of the author and the Acoustical Society of America.

The article appeared in JASA Express Letters 3, 055203 (2023) and may be found at the following link:

Read More

SpeechMark Newsletter September 2023

SpeechMark Newsletter


Announcing SpeechMark MATLAB Toolbox Version 1.4.
This update offers certain SpeechMark functionality that is only available through the MATLAB toolbox.  It does not affect other SpeechMark products.Elevating Your VisualizationsWith Version 1.4, the toolbox gets a long-overdue update to a feature surrounding the plotting and graphing functionality of SpeechMark. Previously, plots were constructed with a distinctive black background optimized for contrast. However readable these black backgrounds were, a challenge arose because scientific journals conventionally feature white backgrounds. This made SpeechMark data integration a difficulty. The best you could do was use MATLAB’s built-in, but incomplete, whitebg function. With the introduction of updated and new plotting functions, our visuals now effortlessly integrate the white backgrounds conventionally preferred in scientific journals.We still allow users to use black backgrounds, which have a high level of clarity and contrast. However, our latest update introduces the function ‘smbg_color‘ to reverse the background and other colors of all later plots, to allow for the more accepted white backgrounds. Just type its name! And type it again if you want to toggle back to plotting black backgrounds. This will not affect any plotting outside of SpeechMark. The two figures above showcase what this looks like. Type “help smbg_color” for more details.If you use a startup script for SpeechMark and other options, and you want to use the white backgrounds as your SpeechMark default, simply call ‘smbg_color‘ in the script and begin plotting. We hope this new feature will improve the ease of using SpeechMark alongside your other research with a direct line for incorporating figures.
Tweaks and Bug Fixes
For readability, the corners of the vowel quadrilateral are now labeled with their vowels: /i/, /u/, /a/, and /ae/.We have also made updates and fixes to a few of our other SpeechMark functions. In ‘lm_vowel_space’ and ‘mat_lminfo’, we fixed small and uncommon defects, and in ‘fricative_lms’ we fixed a large-memory issue.

DID YOU KNOW?

With SpeechMark’s extensive list of functions, it can be overwhelming to memorize the different arguments all the functions take. Thankfully, all SpeechMark functions respond to “?” with their signature.

For instance, like all SpeechMark functions, ‘stdfig‘ responds to “?” and shows the two arguments that ‘stdfig‘ requires, position and width:
>> stdfig ?
<figno> = stdfig(<POSITION>,<WIDTH>)

Note that many functions within SpeechMark have default behavior or values if certain arguments are omitted or empty ([ ], ” “, or { }). The “?” message shows these in <angle brackets>. In the example, the <.> shows that the ‘figno‘ output is not returned if ‘stdfig‘ is called without an output argument – just like MATLAB’s plot function, but unlike most others.  See “help function” for further details on any SpeechMark function.

SpeechMark Newsletter February 2021

SpeechMark Newsletter


Announcing SpeechMark MATLAB Toolbox Version 1.3.
This updates certain SpeechMark functionality that is only available through the toolbox. It does not affect other SpeechMark products.

New and Enhanced Toolbox Functionality
Strings come to SpeechMark at last! We have updated our entire library to allow you to specify strings as input arguments, such as age/gender or filename. This especially affects the high-level functions such as landmarks, vowel_segs_std, and lm_vowelarea, which permit filenames (and arrays of filenames) as input arguments. However, SpeechMark functions do not produce strings in their returned results, and character arrays are still supported, so any existing code will continue to work as-is.

Bug Fixes
We have also made updates and fixes to some of our internal functions, especially suppressing inappropriate warnings when computing F0 and related voicing measures.


UNDER THE HOOD
SpeechMark uses fuzzy logic in much of its processing. In the coding world, logical normally means exactly true or false, yes or no, 1 or 0. Fuzzy logic, however, is imprecise and subjective, expressing the “degree of membership” in a set or the degree to which a condition is true. This is always a value between 0 and 1, with 0 indicating no membership at all and 1 indicating full membership.

SpeechMark uses what’s called first-order fuzzy logic. For example, the “strength” component of a landmark is the (fuzzy) degree to which a landmark is present. (Well, almost: SpeechMark often multiplies the strength by -1, so be sure to use the absolute value if you want to work with the fuzzy degree.) In the MATLAB toolbox, functions that return fuzzy values are named deg_*, such as deg_sigsgram, deg_voicedhnr, and even deg_speech.

SpeechMark focuses on the physics and neurophysiology of speech production, which is an objective domain. One could, for example, visually determine whether the vocal folds are moving to produce glottal pulses.

However, SpeechMark analyzes acoustic signals. This is sometimes subjective, because it may be a matter of judgement whether, say, vocal-fold motion can be inferred from an acoustic signal, and how firmly. The degree of voicing produced by several of our deg_voiced* functions captures various parts of this imprecision: specifically local evidence from periodic motion, or specifically including various acoustic measures such as nearby landmarks or the local harmonics/ noise ratio HNR.

Using fuzzy logic often entails combining fuzzy measures (of membership in some set of interest) with the fuzzy analogs of the usual logical operators: And, Or, Not, and others. The first two have reassuringly simple rules: From two fuzzy variables A and B whose degrees are a and b, the degree to which both A and B are in the set (i.e., A And B) is just the smaller of a and b, Min(a,b). Likewise, the degree to which at least one is in the set (A Or B) is the larger of the two, Max(a,b).

Where does this appear in SpeechMark? An example is landmark strength. Landmarks are defined by big-enough peaks of energy change that occur simultaneously in at least three spectral bands. Each peak is given a degree to which it is “big enough”, and the landmark’s strength is the third-highest of these. Why the third highest? Because the landmark is defined by the presence of a peak in the strongest band and a peak in the second-strongest and a peak in a third-strongest. (“A chain is only a strong as its weakest link.”)

SpeechMark is cautious using Not. You might be tempted to think that if False corresponds to 0 and True to 1, then the degree of Not A must be 1-(degree of A). But 1-x isn’t the only function that converts 1 to 0 and vice versa. Different versions of fuzzy logic adopt different definitions of Not. (If you work in the Math Department, think of t-norms or negators. The rest of us will be thinking of speech production.) In speech production, the degree to which the acoustic evidence for, say, voicing is strong might not be the degree to which that same evidence for Not-voicing (non-voicing) is weak. The evidence may simply be incomplete (voicing Or Non-voicing < 1) or ambiguous (voicing Or Non-voicing > 1).

So much for today’s math lesson! There may be a quiz in the morning.

SpeechMark Newsletter February 2020

SpeechMark Newsletter


Announcing SpeechMark MATLAB Toolbox 1.2.1.
This updates certain SpeechMark functionality that is only available through the toolbox. It does not affect other SpeechMark products.

New and Enhanced Toolbox Functionality

You asked and we listened! The functions landmarks, vowel_segs_full, and vowel_segs_std can now accept their signal arguments as either a waveform array or a filename. This means that you can read a file into an array (using wavread16k, for example), perhaps preprocess it in some way, and then pass that array to one of these functions; or you can pass the filename directly. In the second case, the function will read the file, converting the signal waveform to the specified sampling rate if needed.

Even better, if you specifically construct the filename with a wildcard, such as ‘*.wav’ or ‘..smdemos\spx*.wav’, the function will bring up a dialog box like the figure above shows. That lets you browse to the right folder and select the specific file interactively.

Likewise, for these three central SpeechMark functions, you can simply specify the AGE_GENDER code of maxf0_std, instead of supplying a numeric value for MAX_F0. You may find the code — “m”, “f”, “i”, or one of the others — more convenient, although the numeric value(s) can be more precisely tailored when you need to.

In addition, we have overhauled and reorganized the Help sections for these three functions, as well as for lm_draw and deg_speechenv (one of SpeechMark’s many fuzzy-logic functions). We hope you find them more… helpful!

NOTE: The SpeechMark toolbox works on many years’ versions of MATLAB. However, certain functions that are present in one version may not be in another. By default, the toolbox is supplied with functions for many recent years. But if you use an older version, just let us know which version: We can easily send you the handful of functions that are needed for that version.

Bug Fixes
The lm_draw function sometimes failed to show the landmark codes when drawing a figure with landmarks or with the vowel_segs_* functions. This defect has now been fixed.

DID YOU KNOW?
When you analyze or report speech-processing results, it may be important to document which version of SpeechMark you used. That’s the very purpose of the toolbox function smmlt_version. It returns the text for the version number and, optionally, for the version’s date. For example, you might like to place the version number into the title of a landmarks plot before you save it for posterity:
>> [vsn,dat] = smmlt_version()
returns:
vsn =
‘1.2.1’
dat =
‘2020-1-24’
which you could then use in a TITLE command for a figure window:
>> title([‘This figure was produced with version ‘ vsn]) .

Landmark-based approach for automatically describing the effect of spasmodic dysphonia on speech production: Preliminary case studies

Keiko Ishikawaa and Joel MacAuslan

Abstract: Spasmodic dysphonia causes voice breaks in linguistically inappropriate places in speech. Landmark-based analysis automatically describes this speech segmentation error.

Read More… Download PDF

Copyright (2019) This article may be downloaded for personal use only. Any other use requires prior permission of the author.


Toward clinical application of landmark-based speech analysis: Landmark expression in normal adult speech

Keiko Ishikawaa, Joel MacAuslan, Suzanne Boyce

Abstract: The goal of clinical speech analysis is to describe abnormalities in speech production that affect a speaker’s intelligibility. Landmark analysis identifies abrupt changes in a speech signal and classifies them according to their acoustic profiles. These acoustic markers, called landmarks, may help describe intelligibility deficits in disordered speech. As a first step toward clinical application of landmark analysis, the present study describes expression of landmarks in normal speech. Results of the study revealed that syllabic, glottal, and burst landmarks consist of 94% of all landmarks, and suggest the effect of gender needs to be considered for the analysis.

Read More… Download PDF

Copyright (2017) Acoustical Society of America. This article may be downloaded for personal use only. Any other use requires prior permission of the author and the Acoustical Society of America.

The following article appeared in The Journal of the Acoustical Society of America 142, EL441 (2017) and may be found at http://asa.scitation.org/doi/10.1121/1.5009687.

Application of Laryngeal Landmarks for Characterization of Dysphonic Speech (2017)

Keiko Ishikawa, Joel MacAuslan, Suzanne Boyce
People don’t understand me in noisy places” is one of the most commonly reported concerns among individuals with dysphonia. Dysphonia is often a result of laryngeal pathology, which elicits greater aperiodicity and instability in a speech signal. These acoustic abnormalities likely contribute to the intelligibility deficit reported by these individuals.

Acoustic analysis is commonly used in dysphonia evaluation. Multiple algorithms are available for characterizing the degree of aperiodicity in speech. Typically, the degree of aperiodicity is measured over a particular length of voicing or speech selected by a user. While such algorithms are effective for describing degree of dysphonic voice quality perceived by listeners, an algorithm that describes timing and frequency of aperiodic moments may provide information more relevant to intelligibility.

Read More… Download PDF

Predicting Intelligibility of Dysphonic Speech with Automatic Measurement of Vowel Related Parameters (2017)

Keiko Ishikawa, Meredith Meyer, Joel MacAuslan, Suzanne Boyce

• Reduced intelligibility is a common complaint among people with dysphonia.

• Vowels carry information that greatly contributes to intelligibility.

• A formant is a cluster of frequencies amplified by the vocal tract. The first two formants are critical for perception of vowels.

• A greater amount of noise and a lack of harmonic power are common characteristics of dysphonic speech signals. These acoustic abnormalities can negatively affect perceptual resolution of formants.

Read More… Download PDF

Automated Analysis of Syllable Complexity as an Indicator of Speech Disorder (2017)

Marisha Speights, Joel MacAuslan, Noah Silbert, Suzanne Boyce
This study was designed to examine the feasibility of the Syllabic Cluster algorithm in the SpeechMark® MATLAB toolbox as an automated approach for identifying differences in speakers with and without Speech Sound Disorders(SSD).

Background

  • In the course of normal development, children master voluntary coordination of the motoric movements necessary for the utterance of complex syllables.
  • Development of well-formed syllables has been shown to be a significant predictor of later communication skills.
  • Children with delayed speech production show atypical trends in the mastery of well-formed syllables, especially in continuous speech.

Read More… Download PDF