SpeechMark Newsletter
|
|
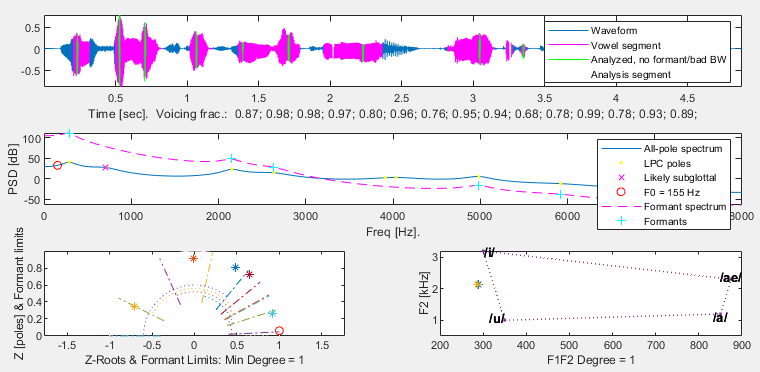
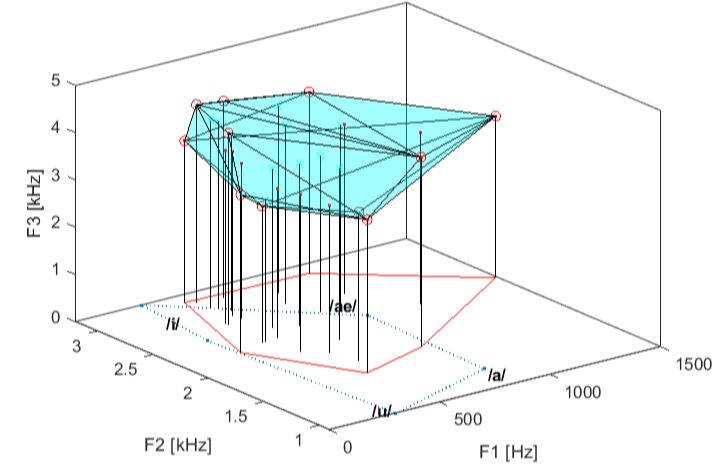
Some of the SpeechMark plotting functions produce rather complex plots. A previous newsletter discussed how you can easily edit them with the built-in MATLAB tools to change their appearance or remove elements (and even undo this when you make a mistake). Two examples of such functions are lm_draw and plot_vowelarea. If you know what to look for, you will see that they can tell you about faint or weakly detected features.
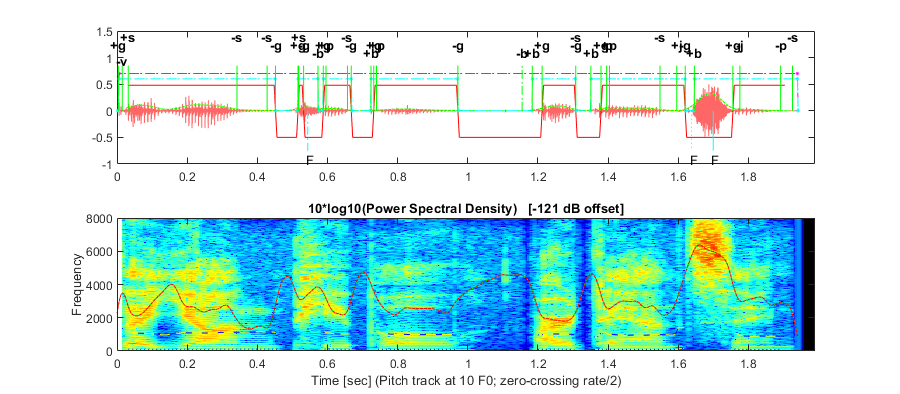
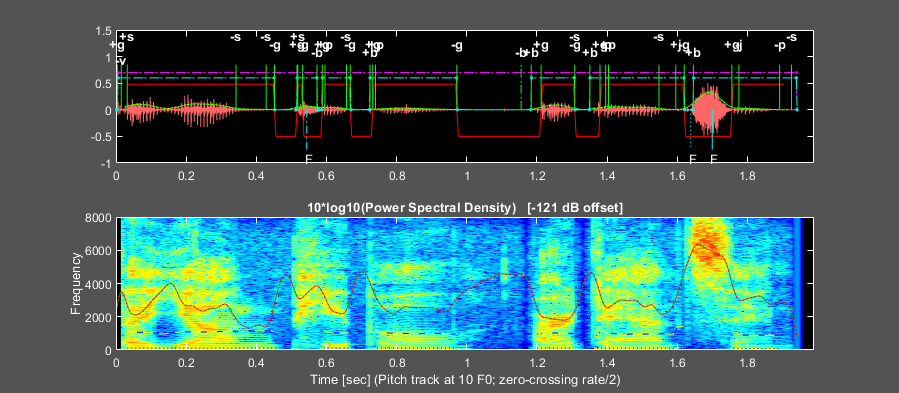
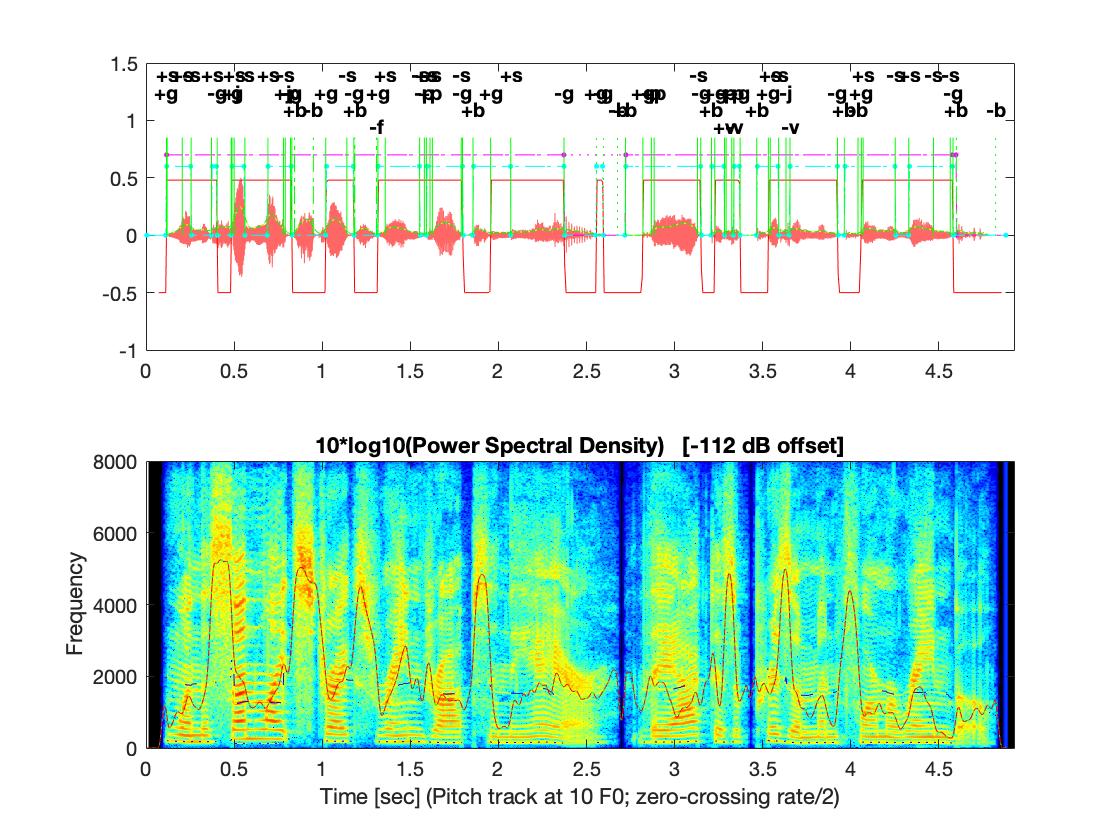
lm_draw plots a speech-acoustic signal and its spectrogram with the associated array of landmarks. In the picture below, the landmarks are shown with vertical green lines. Recall that landmarks themselves consist of a time (where the line is drawn), a type (labeled at the top), and a fuzzy-logic strength, with strength = 1 denoting certainty of membership. What you might not realize is that the solid green lines represent “full-strength” landmarks, with strength near 1, while the dotted green ones represent weaker landmarks, occurring in low-amplitude segments of the signal with a lower strength < 1/2, as in the figure below at 0.6 seconds. Based on these, horizontal cyan dashed lines connect two strong landmarks to identify the certain start and end of syllable clusters, whereas dotted cyan ones identify syllable clusters that are less certain, starting or ending at weaker landmarks, as near 5.2 seconds.
|

