SpeechMark Newsletter May 2024

SpeechMark Newsletter


Announcing SpeechMark MATLAB Toolbox Version 1.5

This update offers certain SpeechMark functionality that is only available through the MATLAB toolbox. It does not affect other SpeechMark products.

Improving Functionality and Style

Version 1.5 includes the new function deg_unvstop_asp16 to mark aspiration in unvoiced stops and adds functionality to vowel_segs_nsil, which is equivalent to that in vowel_segs_full, and to vowel_segs_std for more robust handling of vowels that follow the onset of nasalization.

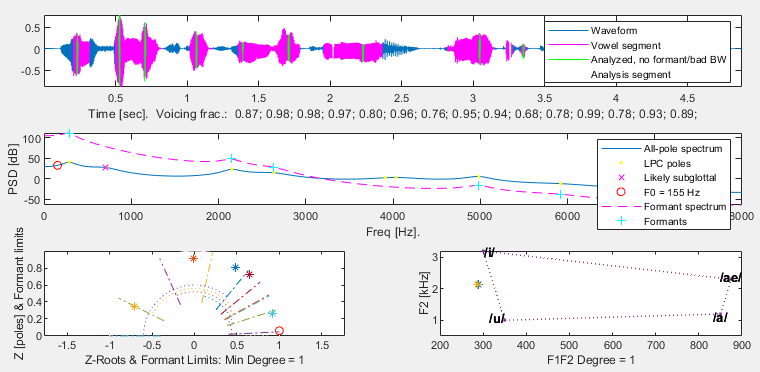
V1.5 also contains two additional demos for testing, smdemo3, whose plots you can see at the beginning of this Newsletter; and smdemo4, which shows how to analyze a batch of speech recordings and summarize the results in a spreadsheet.

The full list of functions fixed in V1.5 can be found in the V1.5 Release Notes. We are working on a version that will contain a deeper analysis of vowels.

Tweaks and Bug Fixes
We have corrected many bugs, especially in landmarks, and improved plotting against white backgrounds. Finally, we have overhauled the Help documentation for landmarks and several other functions.

DID YOU KNOW?

Some of the SpeechMark plotting functions produce rather complex plots. A previous newsletter discussed how you can easily edit them with the built-in MATLAB tools to change their appearance or remove elements (and even undo this when you make a mistake). Two examples of such functions are lm_draw and plot_vowelarea. If you know what to look for, you will see that they can tell you about faint or weakly detected features.

lm_draw plots a speech-acoustic signal and its spectrogram with the associated array of landmarks. In the picture below, the landmarks are shown with vertical green lines. Recall that landmarks themselves consist of a time (where the line is drawn), a type (labeled at the top), and a fuzzy-logic strength, with strength = 1 denoting certainty of membership. What you might not realize is that the solid green lines represent “full-strength” landmarks, with strength near 1, while the dotted green ones represent weaker landmarks, occurring in low-amplitude segments of the signal with a lower strength < 1/2, as in the figure below at 0.6 seconds. Based on these, horizontal cyan dashed lines connect two strong landmarks to identify the certain start and end of syllable clusters, whereas dotted cyan ones identify syllable clusters that are less certain, starting or ending at weaker landmarks, as near 5.2 seconds.

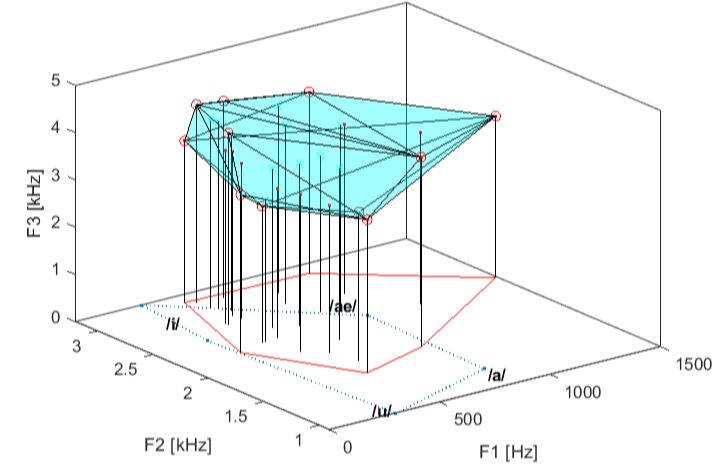
plot_vowelarea, on the other hand, plots formant sets in F1-F2 or F1-F2-F3 space, either in linear scale or logarithmic (proportional to octaves). As in the figure below, plot_vowelarea shows a vowel as a dot if all of its formants have normal bandwidth, or as an “X” if any of its formants has high bandwidth. It uses formant_decay_limits to make this determination. A true vowel’s formant can have a high bandwidth, especially if weakly detected. However, high bandwidth is sometimes an indication of some other acoustic feature, such as nasal or tracheal resonance. So these “X” points denote less-certain vowels.

While these functions can be used by themselves, both lm_draw and plot_vowelarea are called inside more frequently used functions, like landmarks and vowelarea. Therefore, lm_draw and plot_vowelarea have similar functionality and application to the functions that call them.

As always, if you need more detailed explanations of certain functions, consider reading the function’s documentation by typing ‘doc function_name’ or ‘help function_name’. If you are new to SpeechMark, try out demos smdemo1 through smdemo4 in the smdemos folder. They can familiarize you with some of SpeechMark’s features and show you how to solve your own problems. And as always, email us with questions or suggestions.